The paintings in this exhibition are representations of candlestick charts commonly used by traders and analysts to track the price movements of financial assets. Invented by a Japanese rice trader in the 18th century and popularised in the late 20th century by stocks and commodities traders, they have recently proliferated through the public consciousness and image circulation system through their extensive use with Bitcoin and alternative cryptocurrencies.
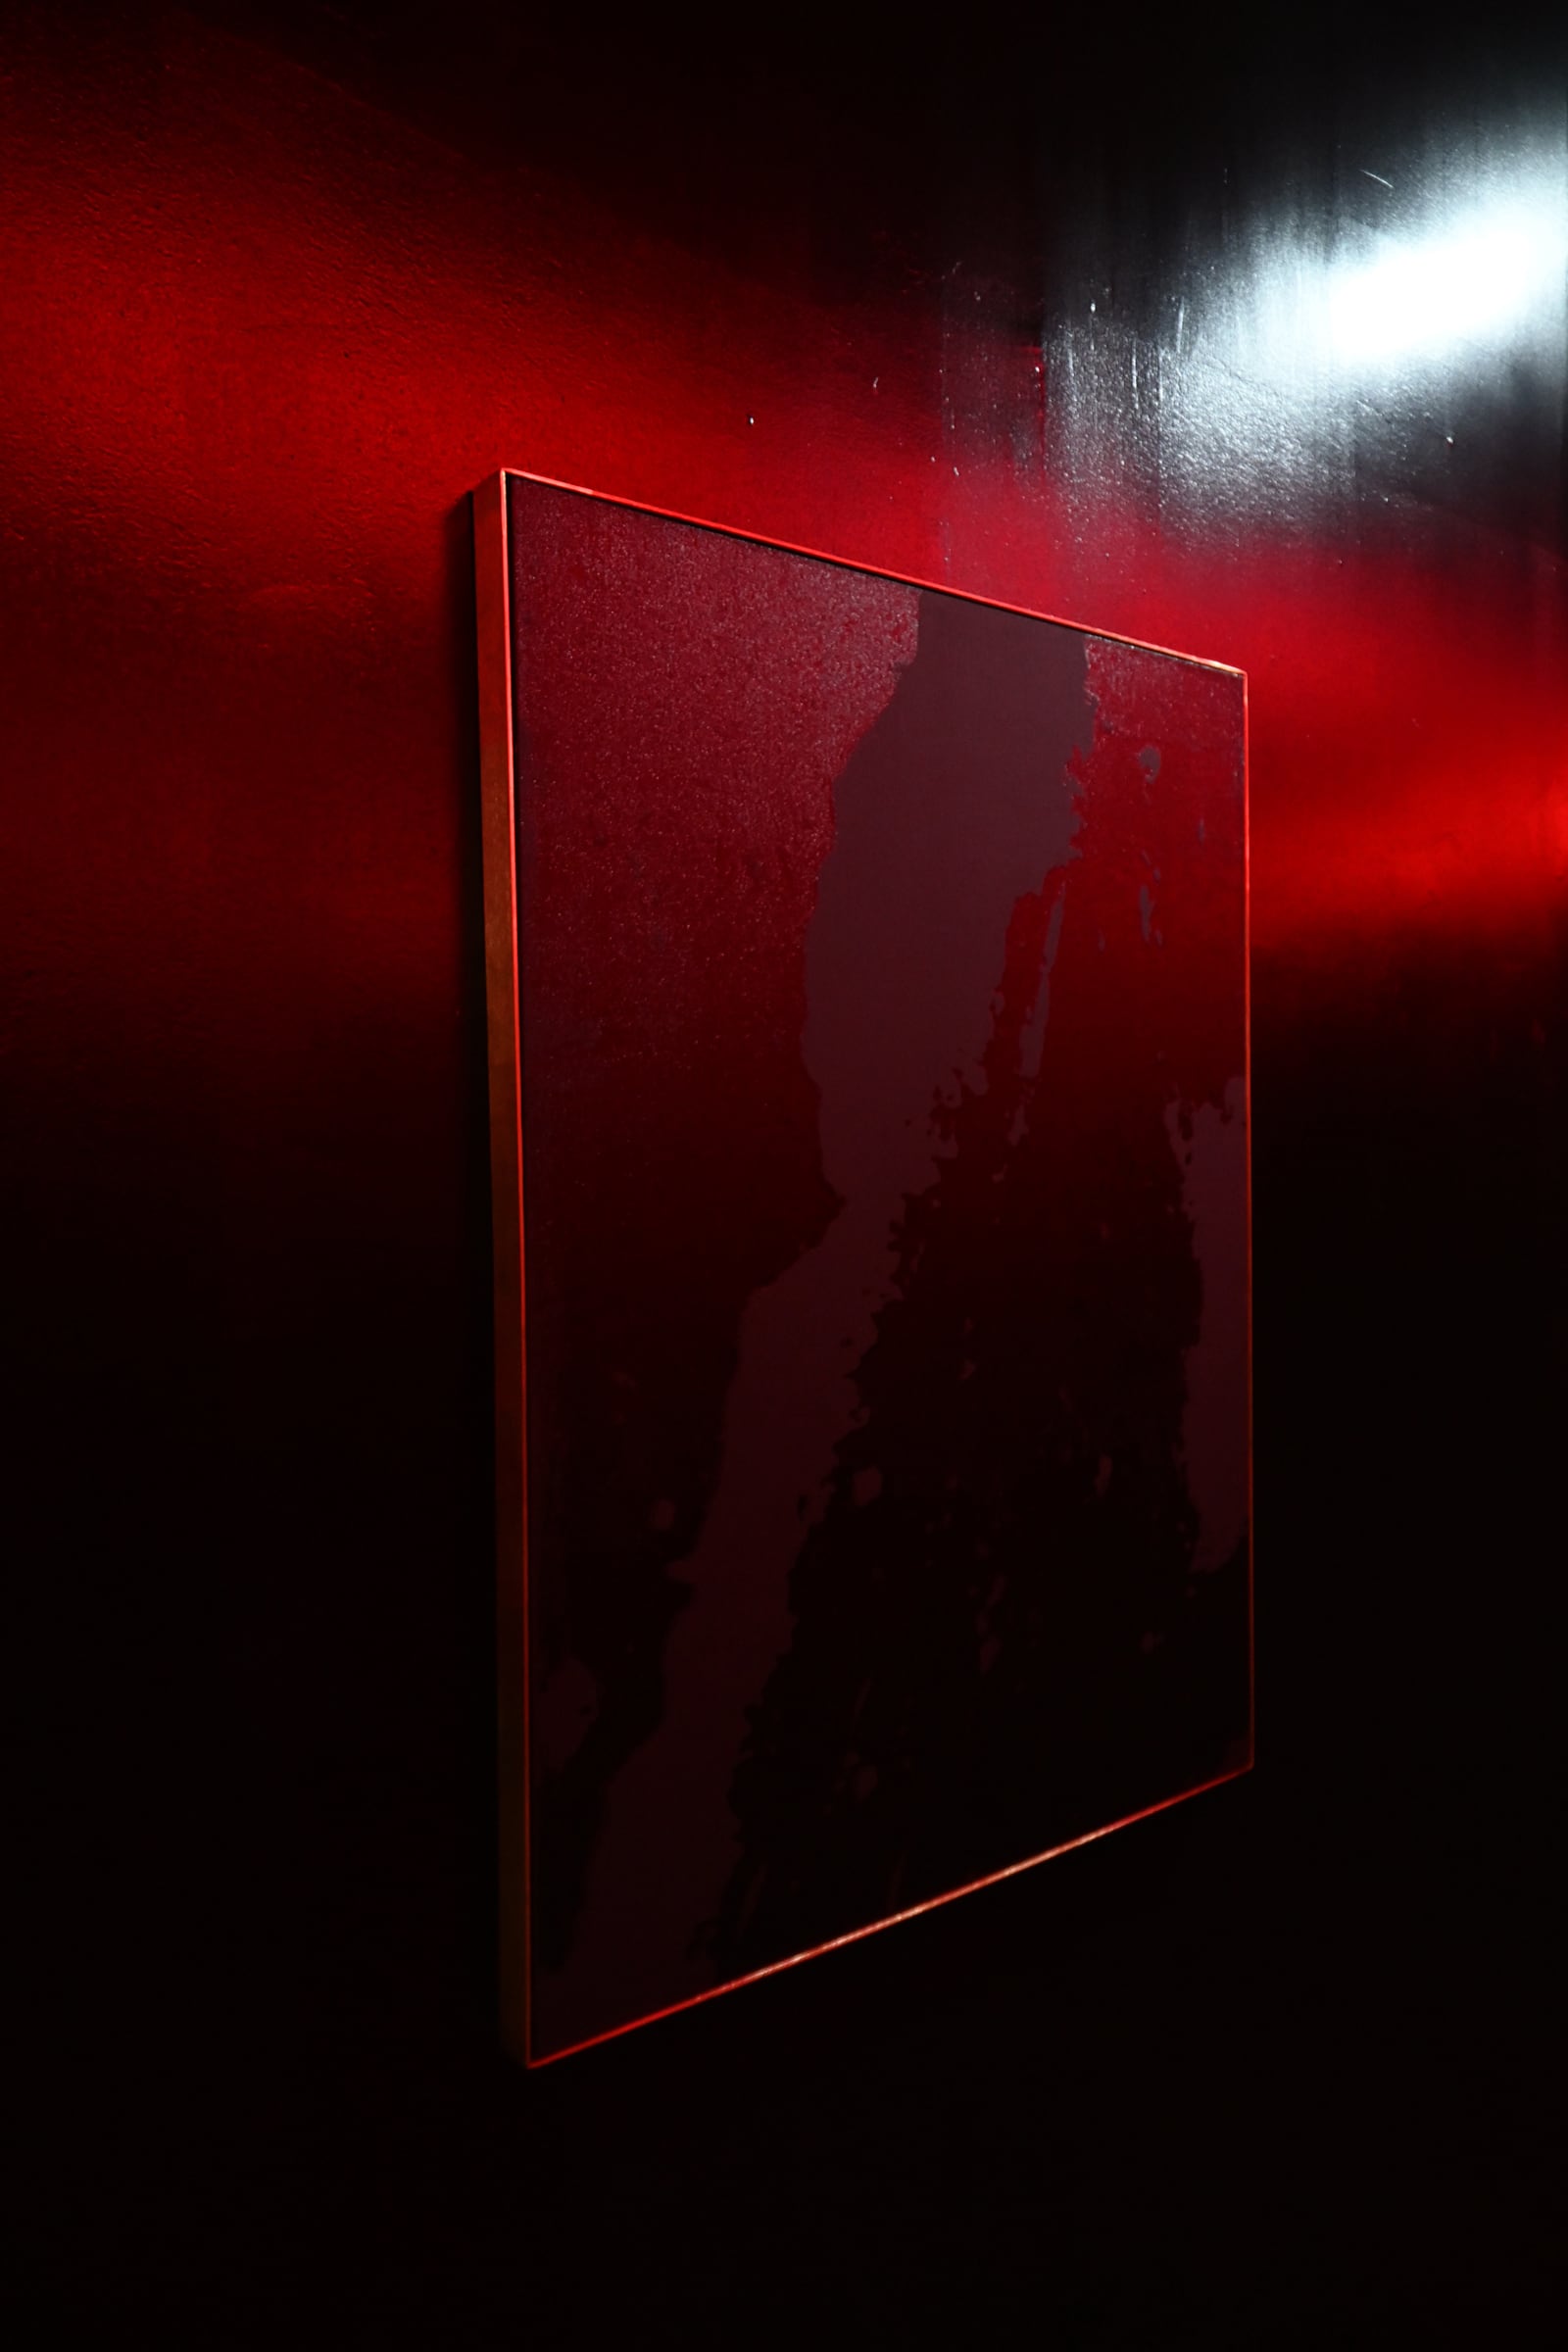
Candlestick charts operate by displaying historical price data for the purpose of analysing patterns to predict future movements. A green candle represents an upwards movement in price for the given time frame while a red candle represents a downwards movement. The black or night mode background, utilised in these paintings, serves to lower the contrast and brightness to make the red and green appear less intense and easier to digest and analyse. Being opposite colours as well as possessing the cultural connotations of negativity and positivity, red and green are well suited to signify the two opposing movements while being intuitively registered by the chart viewer. Additionally, red and green colour accurately mixed together will produce black, making the red, green and black in these paintings form an interactivity and complementariness in background and foreground. Red ticks of negativity and green ticks of positivity emerge from a medium of black neutrality and an order of colour and numerical value is reached utilising an entire spectrum.
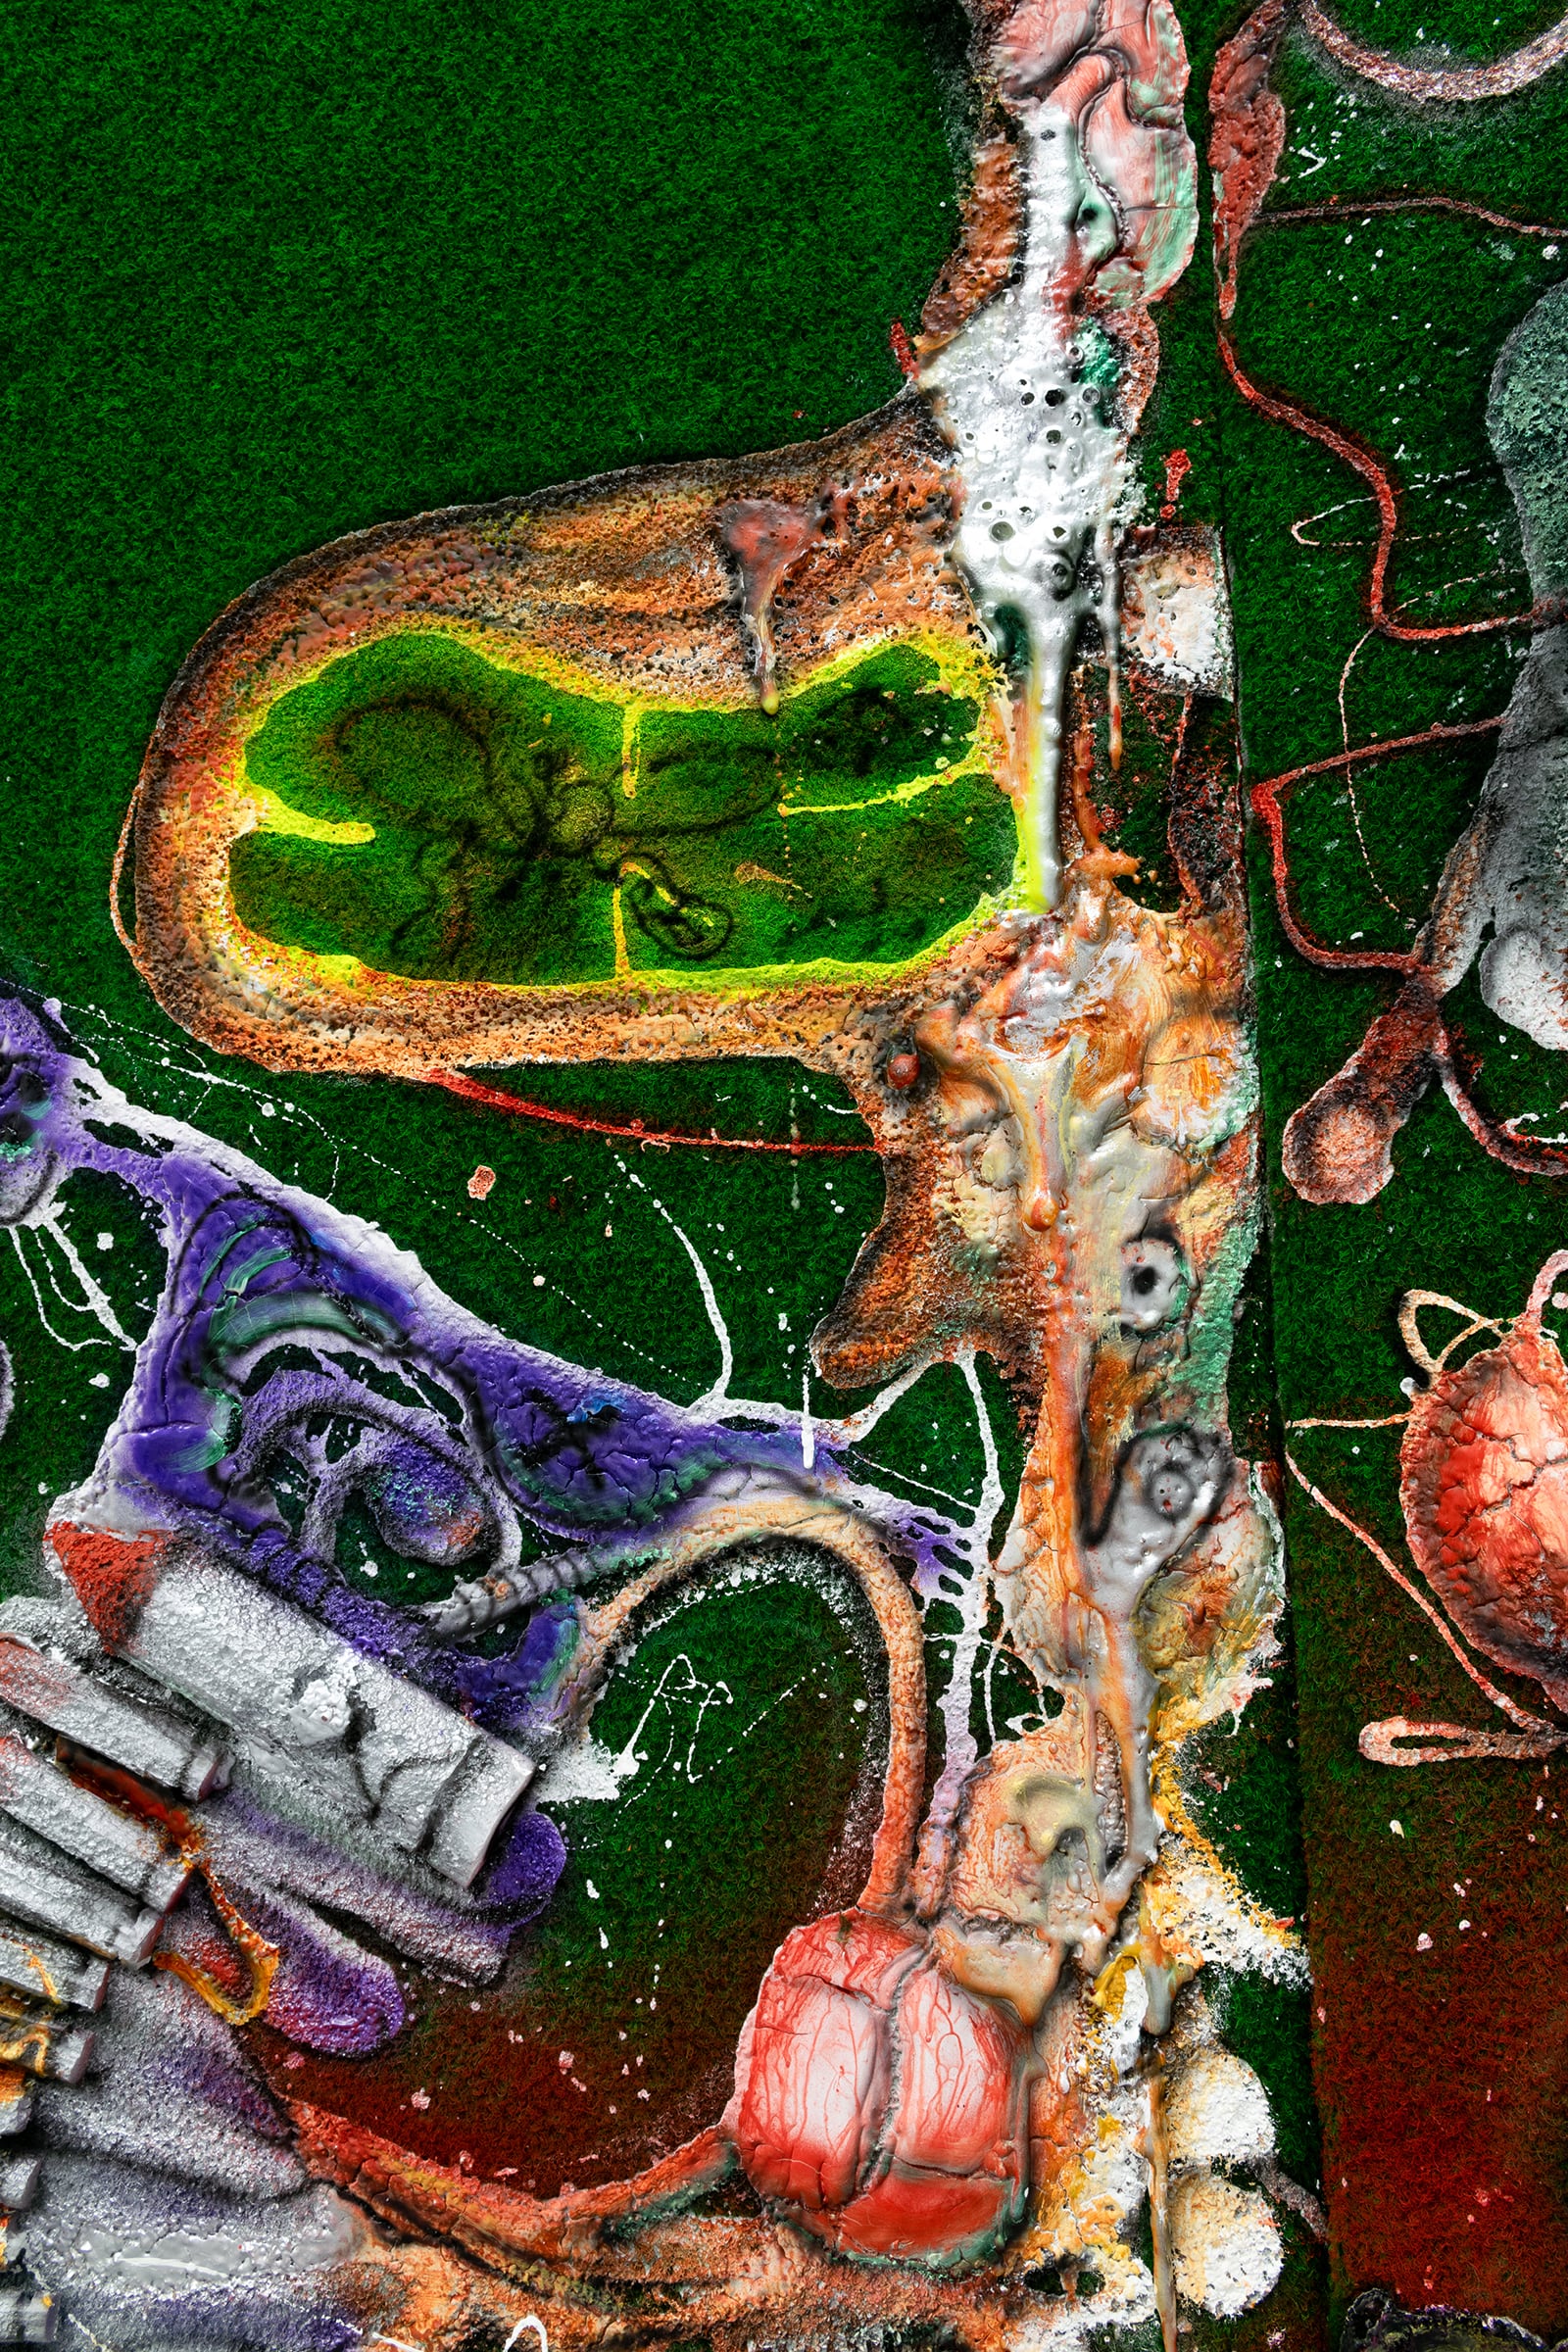
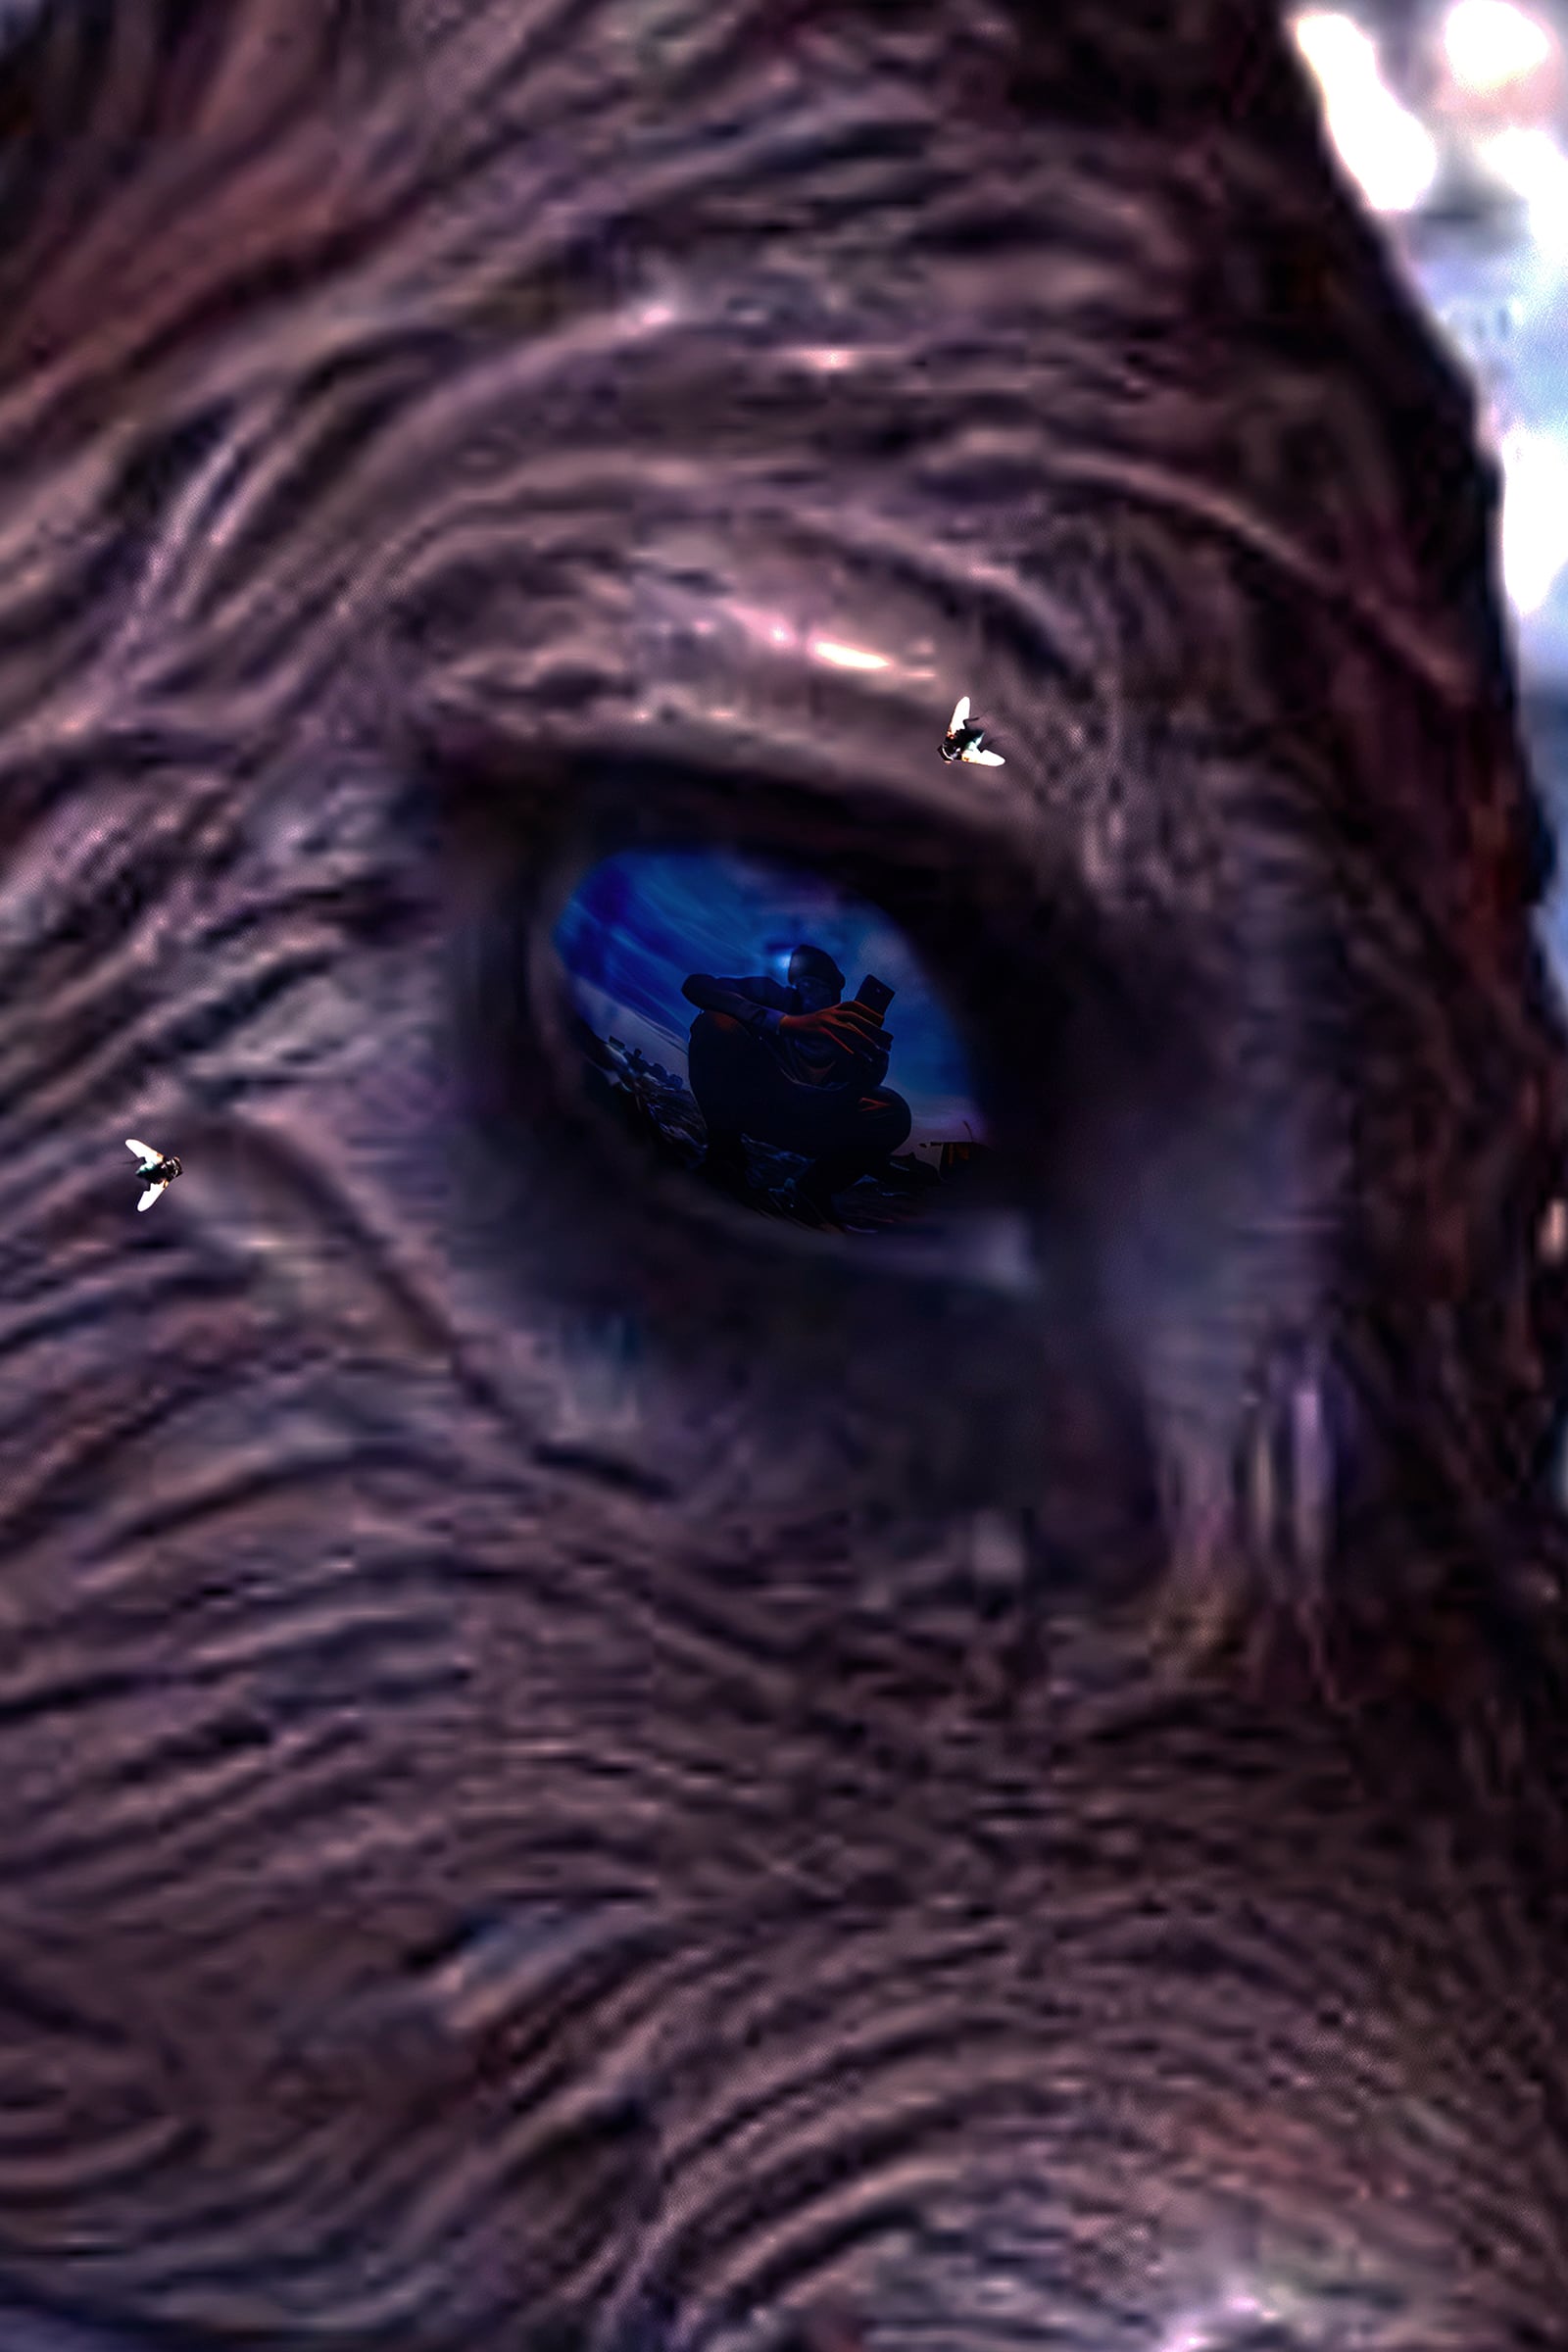
The backgrounds are not pure black, rather, opposing layers of darkened transparent colours, including red and green, purple and yellow, blue and orange, are applied over a white gesso grounding. Eventually, after many layers, the white only appears as a dim reflective glow lighting up the layers of pigment and oil that have now neutralised into a coloured blackness. The result becomes the atmosphere of the chart's universe, which varies from painting to painting. Within the darkness of each painting, variations in colour shine through or are blocked out by its opacity. In certain works, imagery such as figures, words, faces, maps and symbols can be seen along with collaged paper, the medium of writing, all of which seem to point to narratives defining each universe created by the chart. These atmospheres can thus be read into and reflected upon, making each chart painting a unique poetic narrative, or an esoteric navigational map.
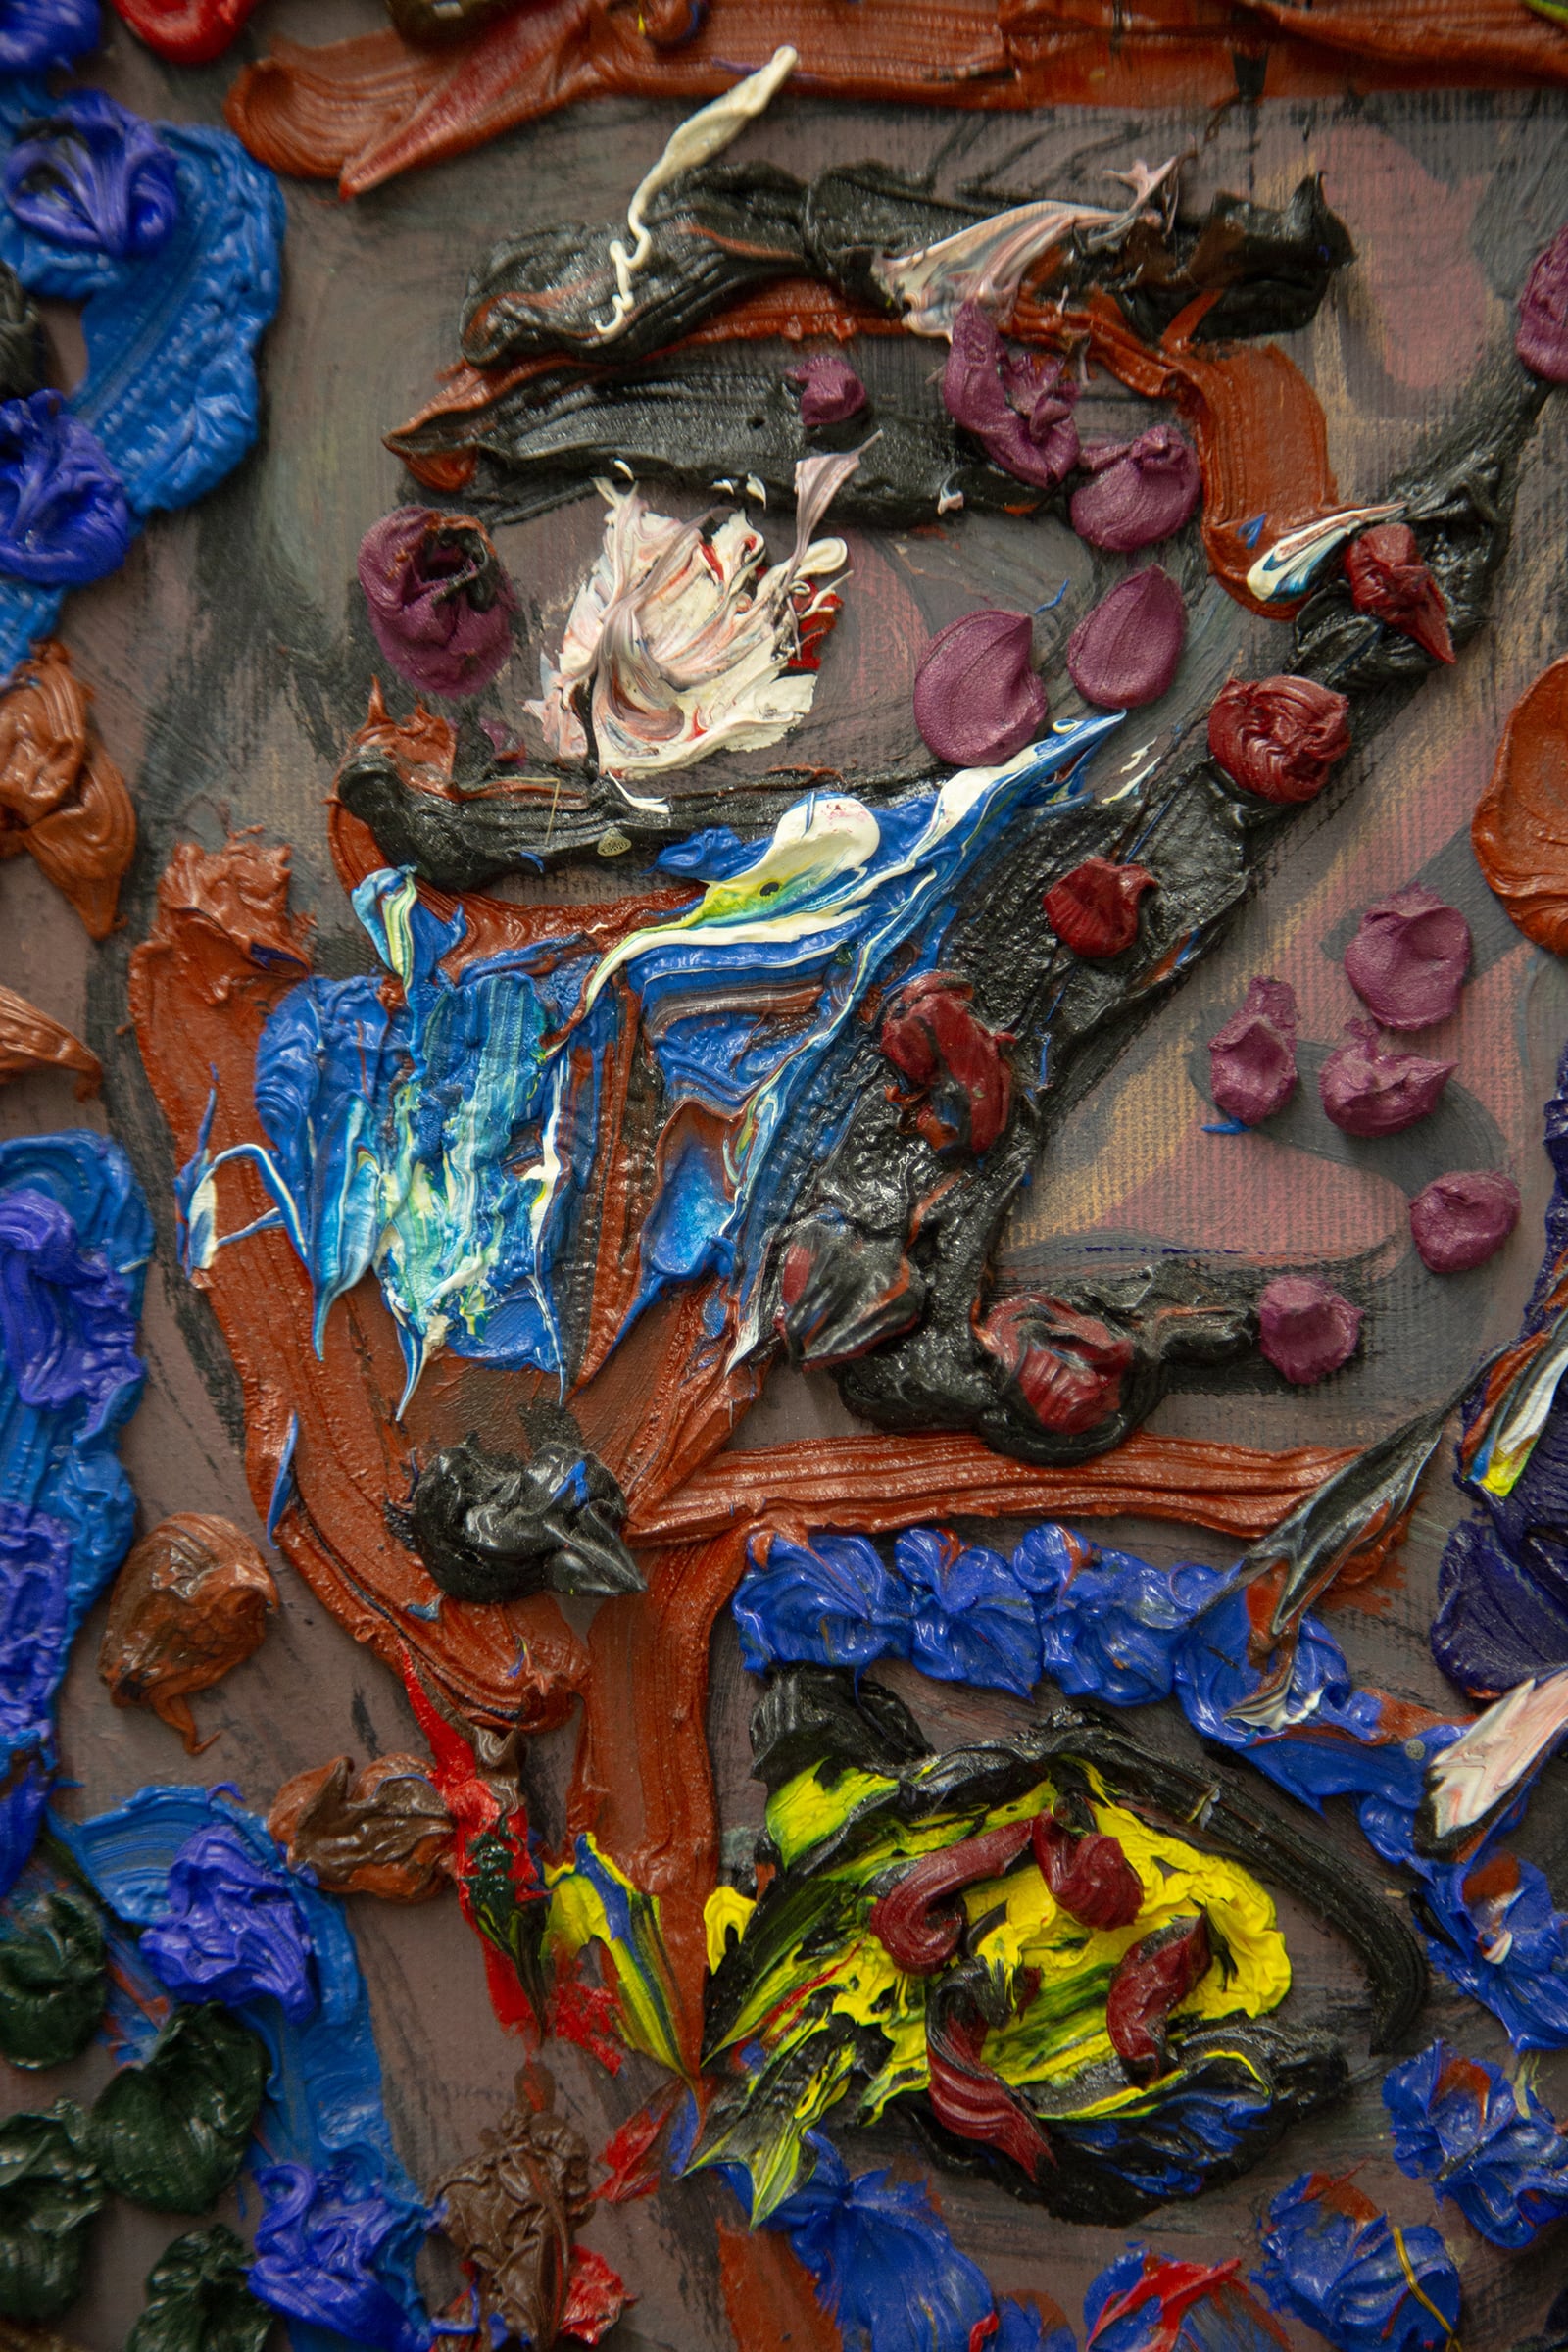
Each traditional candlestick represents price movement during a given time period such as a minute, hour, day, etc. As time drifts by on the horizontal axis, candles are lit up in the darkness at each interval capturing the up and down movements in price. However, the works here are paintings first and charts second, as emphasised by their painterly qualities that stress the basic properties of oil paint and painting history such as glazes, scumbles, drips, impasto strokes and general variety and thickness of mediums. They are stylistically distant from the visual outputs of the charting software which define the original images of charts and are for the most part stripped of all referential data connecting them to actually existing charts of existing assets. Without clear identifying information, the candles themselves initially appear as almost senseless progressions and regressions of red and green bars. We are then forced to begin our interpretation using the coded information in their backgrounds discussed above. However, the candles themselves are painted in a way that begins to tell their own story. Even the chart paintings with fairly rectangular and two-dimensional candles possess a layered depth of colour and softness of texture suggesting something beyond the banality of numerical plotting. And the majority of the paintings take the candles further into three-dimensional or cloudlike forms which reinforce this animated existence. Additionally, all candles appear to be embodied with an internal glow of their own as well as a reflective glow from some presumed ambient light within the atmosphere of each chart. In these ways, a relationship between the candles and their atmosphere is established beyond their numerical value relation and evidence of an internal relation, unique to each individual candle, is given, much like stars twinkling in the night sky who all possess their own chaotic solar system.
The aesthetics of the up and down patterns of movement in the red and green candles themselves is one of the first things to take notice of on any candlestick chart. These movements of the candles are not determined by the intrinsic value of the asset but by the collective action of all market participants with a wide range of motivations for executing the buy and sell orders which push the market price up and down. But what causes them? Fear, greed, risk management, group think, fomo, despair, but also more tactical and aggressive: stop hunting, liquidation triggering, insider information, manipulation. A complex game where traders attempt to gauge when other traders will experience these motivations while attempting to not fall victim to forced motivations themselves. The result is that charts represent some sort of collective psychology of market participants where movements follow almost universal laws of nature such as fibonacci ratios, wave progressions, hitting supports and resistances like a bouncy ball, or the winding of Amazonian tributaries, yet are as unpredictable in these harmonious rhythms as brain activity readings of psychosis. The chart paintings, with their painterly qualities of representation, then seem to depict these abstracted remainders behind the price, such that in them one could read positive and negative movements in almost anything from basic mathematics or physics to environmental phenomenon, human emotions such as love and despair or mania and depression, even to the point where it makes sense to simply say the candles are the manifestation of some sort of soul.
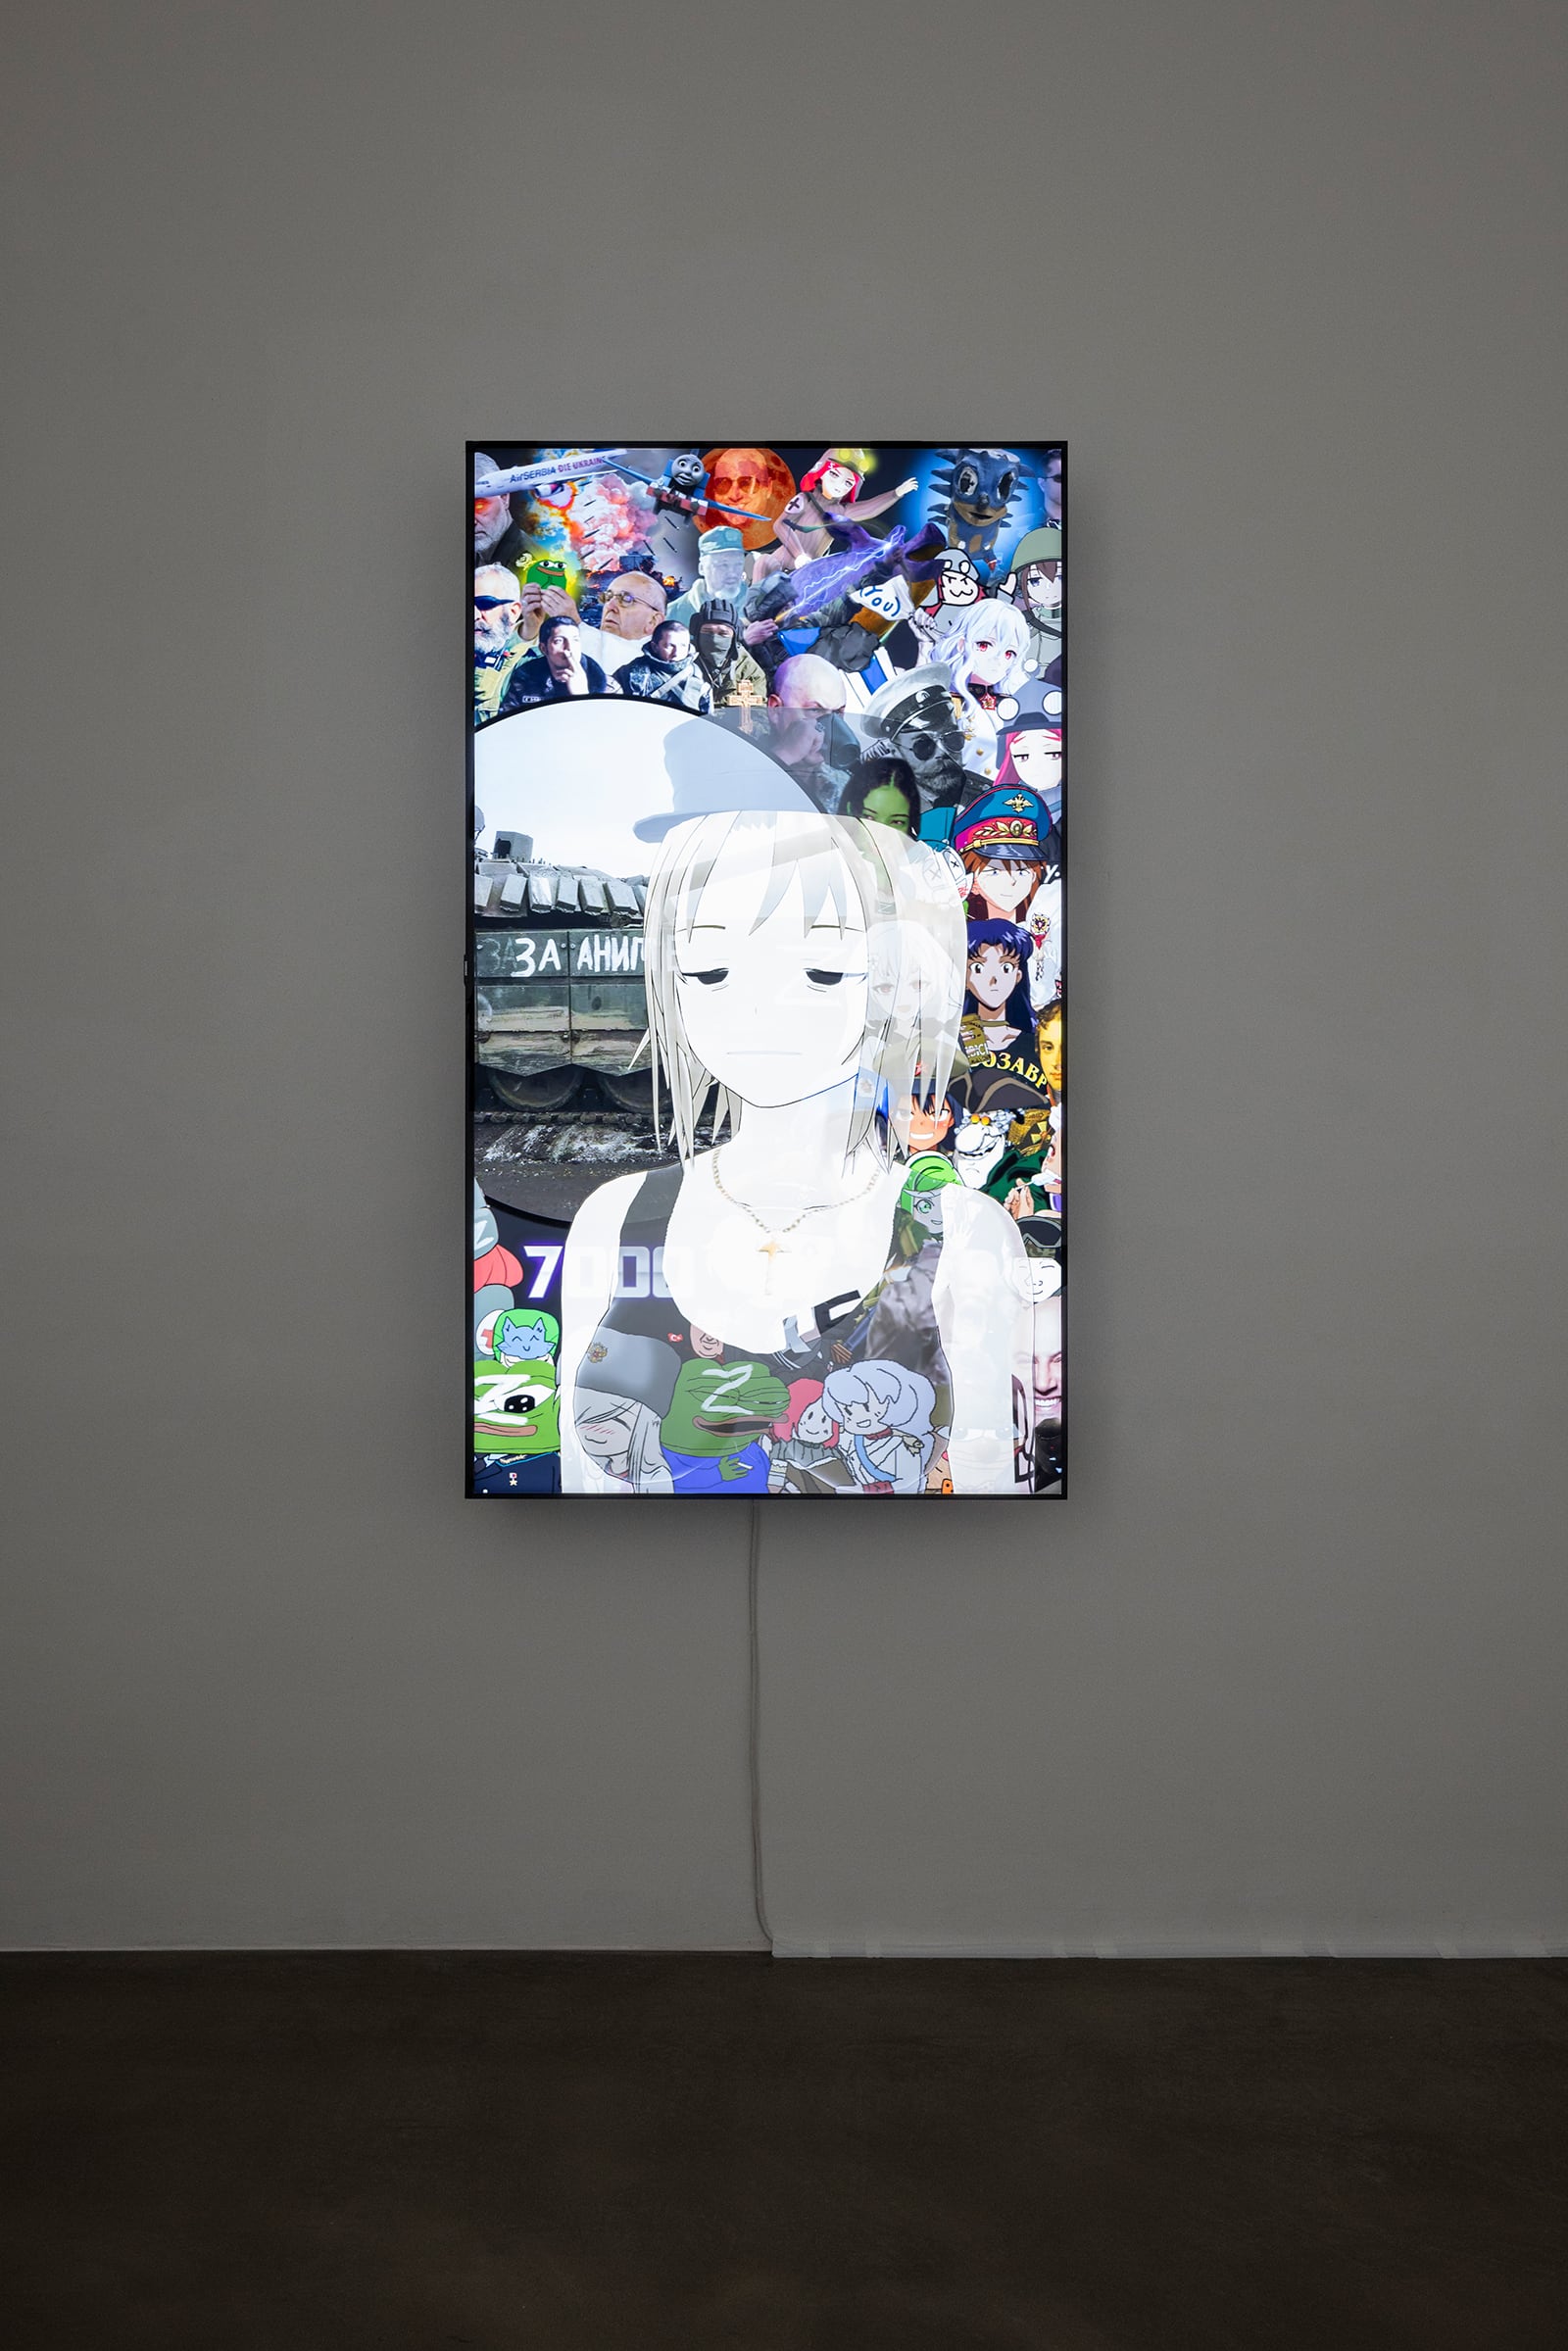
Sometimes the charts do depict real historical situations, which behave in the form of epic dramas. For example the economic panic of 2020 and the over exuberance of 2021 which played out in many different ways for many different people is represented by a handful of candles on the Bitcoin chart painting of those years, or the Russian Ruble/United States Dollar chart during the Ukrainian War appearing as an almost perfect sine wave as the market struggled to interpret the economic effects of the conflict. In these we can see that the artist’s decision to elevate charts to a higher status is so natural and fitting to how powerful an actual market chart can be in its most simple form, automatically generated, candlestick to candlestick, by charting software rather than as artistic works.
The artist’s preoccupation with charts identifies them as a participant within the wider cultural trend of the past few years of amateur trading of cryptocurrency and meme stocks. The trend, stemming from the uneven employment environment and an economic bubble caused by the low interest rates of 2021, seems to be somewhat fitting for artists who are used to analysing and following cultural trends. However, the number, variety and mystification of chart paintings, representing only a fraction of the ones existing in the artist's ongoing series (he has painted only charts for the past two years) also points to an obsession. In this obsession, an oscillation between lucidity and delusion brings the charts to an almost spiritual level in their capacity to represent aspects of human existence as well as the deeper universe, both physical and imagined, beyond our understanding, giving the charts their final license for open ended interpretation.


.jpg)

-13.jpg)